
The Dollar index remains in a bearish trend. The index made a bounce towards short-term resistance but it is far from confirming a bullish reversal in the 4 -hour chart. The 4-hour trend change level coincides with the 38% Fibonacci resistance level that bulls need to break for a bigger bounce to unfold.
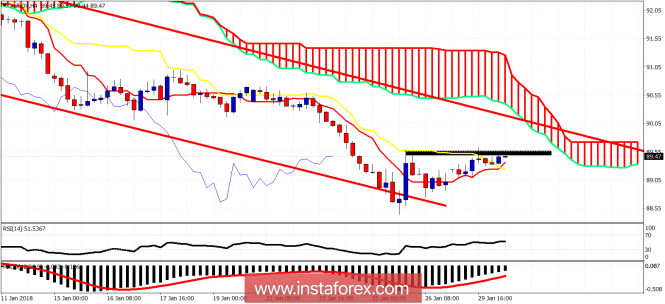
Black rectangle - resistance
The Dollar index is breaking above the tenkan- and kijun-sen indicators in the 4-hour chart. This implies that there are increased chances that the Ichimoku cloud resistance and the upper channel boundary will be tested. This resistance level is at 90-90.30. Support is at 89.30.
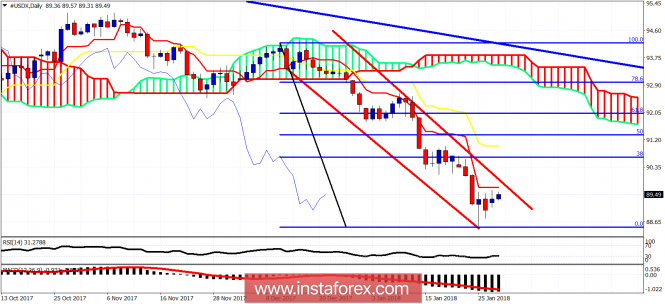
The Dollar index remains in a bearish trend. Price is making lower lows and lower highs. Resistance is at 89.70 and next at 91. Price remains inside the bearish channel. A rejection at 89.70 will open the way for a new low towards 88-87.50. This is not the time to be chasing short positions but to wait for a clear reversal signal.
The material has been provided by InstaForex Company - www.instaforex.com