
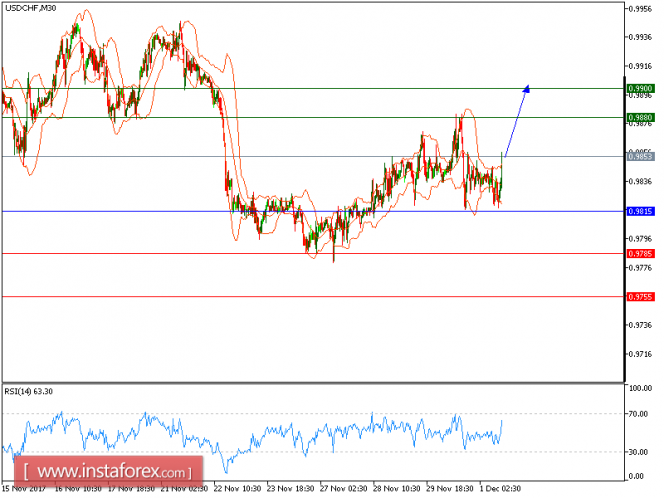
USD/CHF is expected to trade with a bullish outlook. The pair managed to hold above its key horizontal support at 0.9815, and is likely to post a new bounce. The bullish trend line should maintain the strong buying pressure on the prices. Last but not least, the relative strength index stands above its neutrality area at 50.
To sum up, as long as 0.9815 is not broken, look for further advance to 0.9880 and 0.9900 in extension.
Chart Explanation: The black line shows the pivot point. The present price above the pivot point indicates a bullish position, and the price below the pivot points indicates a short position. The red lines show the support levels and the green line indicates the resistance levels. These levels can be used to enter and exit trades.
Strategy: BUY, Stop Loss: 0.9815, Take Profit: 0.9880
Resistance levels: 0.9880, 0.9900, and 0.9935
Support levels: 0.9785, 0.9755, and 0.9720
The material has been provided by InstaForex Company - www.instaforex.com