MG Network

something big isHappening!

In the mean time you can connect with us with via:

Copyright © Money Grows Network | Theme By Gooyaabi Templates

Money Grows Network

Archive

Powered by Blogger.

Welcome To Money Grows Network

Verified By

2006 - 2019 © www.moneygrows.net

Investments in financial products are subject to market risk. Some financial products, such as currency exchange, are highly speculative and any investment should only be done with risk capital. Prices rise and fall and past performance is no assurance of future performance. This website is an information site only.

Popular

Pages

Expert In

Name*


Message*

Ichimoku cloud indicator analysis of USDX for December 18, 2017

The Dollar index bounced strongly off the 50% Fibonacci retracement and the cloud support in the 4-hour chart as expected. The Dollar index reached 94 which is important short-term resistance and is showing rejection signs.

analytics5a3774fb33827.png

Red rectangle - resistance area

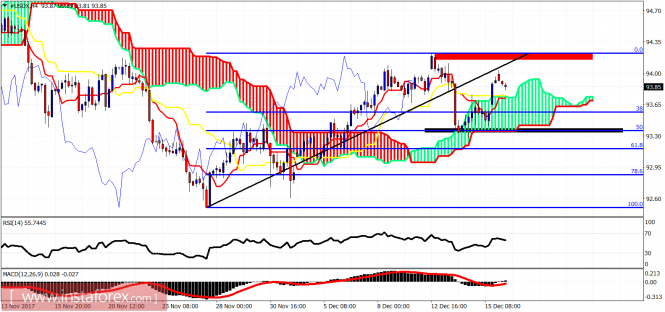
Black rectangle - support area

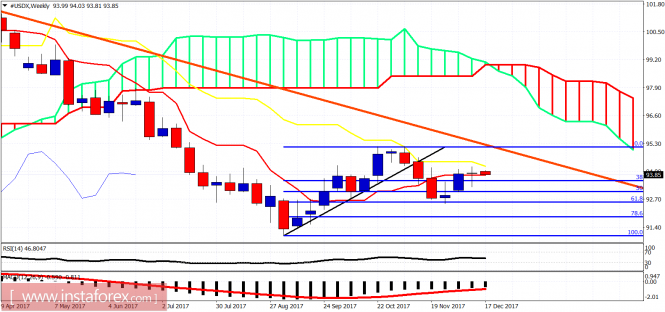
The Dollar index is at an important junction. A break above 94.05 will open the way for a move towards 96. A fall below 93.40 will push price towards 92.50 critical low. First important short-term support is at 93.30-93.40. Bulls do not want to see it broken.

analytics5a37756dd96f0.png

Last week's weekly candle is a bullish one, implying price should continue higher towards weekly kijun-sen resistance at 94-94.30. A weekly break above this resistance level will be a very bullish break out that will eventually push price towards our target of 96-97. The bullish scenario gets canceled if we break below 92.50.The material has been provided by InstaForex Company - www.instaforex.com