
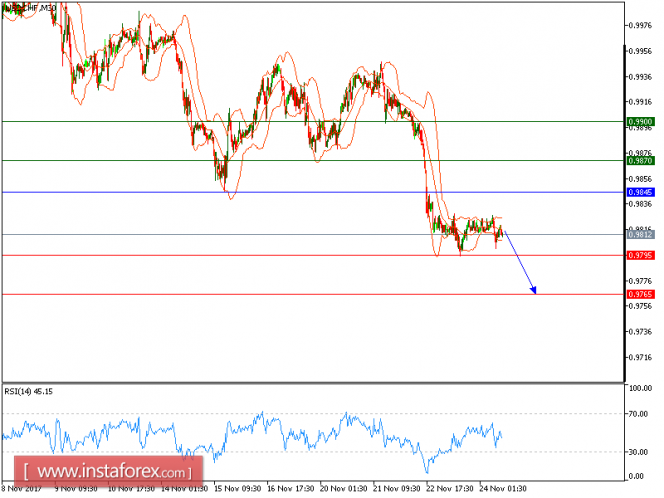
USD/CHF is under pressure. The pair remains weak below its horizontal resistance level at 0.9845. Both the 50-period moving average is still on the downside, and calls for a new decline. Last but not least, the relative strength index lacks upward momentum.
In which case, as long as 0.9845 is not surpassed, likely decline to 0.9795 and 0.9765 in extension.
Chart Explanation: The black line shows the pivot point. The present price above the pivot point indicates a bullish position, and the price below the pivot points indicates a short position. The red lines show the support levels and the green line indicates the resistance levels. These levels can be used to enter and exit trades.
Strategy: SELL, Stop Loss: 0.9845, Take Profit: 0.9795
Resistance levels: 0.9870, 0.9900, and 0.9950
Support levels: 0.9795, 0.9765, and 0.9730
The material has been provided by InstaForex Company - www.instaforex.com