
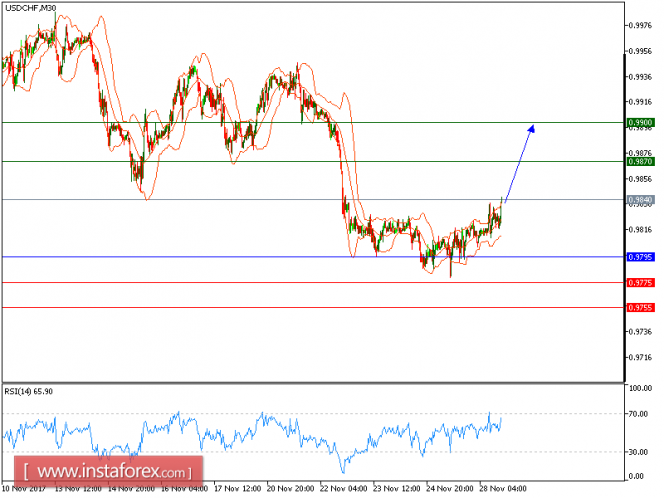
USD/CHF is expected to trade with a bullish outlook. The pair managed to break above its intraday falling trend line, and is now heading upward. The relative strength index is displaying strong bullish momentum. Both the 20-period and 50-period moving averages are turning up, and should call for further advance.
In which case, as long as the key support at 0.9795 holds on the downside, look for further advance to 0.9870 and 0.990 in extension.
Chart Explanation: The black line shows the pivot point. The present price above the pivot point indicates a bullish position, and the price below the pivot points indicates a short position. The red lines show the support levels and the green line indicates the resistance levels. These levels can be used to enter and exit trades.
Strategy: BUY, Stop Loss: 0.9795, Take Profit: 0.9870
Resistance levels: 0.9870, 0.9900, and 0.9900
Support levels: 0.9775, 0.9755, and 0.9700
The material has been provided by InstaForex Company - www.instaforex.com