
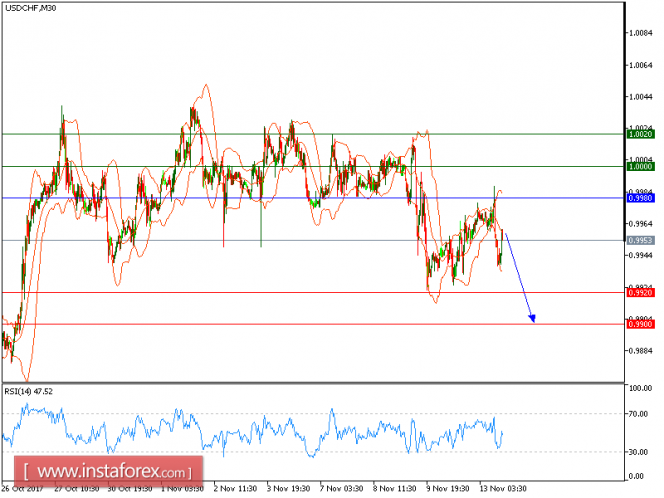
Our first target which we predicted in previous analysis has been hit. The pair is again turning down after the short rebound, and also broke below its 50-period moving average. The relative strength index is turning down, and calls for a new drop. Last but not least, the nearest resistance at 0.9980 maintains the strong selling pressure on the prices.
As long as 0.9980 holds on the upside, look for a new pullback to 0.9920 and 0.9900 in extension
Chart Explanation: The black line shows the pivot point. The present price above the pivot point indicates a bullish position, and the price below the pivot points indicates a short position. The red lines show the support levels and the green line indicates the resistance levels. These levels can be used to enter and exit trades.
Strategy: SELL, Stop Loss: 0.9980, Take Profit: 0.9920
Resistance levels: 1.0000, 1.0020, and 1.0045
Support levels: 0.9920, 0.9900, and 0.9860
The material has been provided by InstaForex Company - www.instaforex.com