MG Network

something big isHappening!

In the mean time you can connect with us with via:

Copyright © Money Grows Network | Theme By Gooyaabi Templates

Money Grows Network

Archive

Powered by Blogger.

Welcome To Money Grows Network

Verified By

2006 - 2019 © www.moneygrows.net

Investments in financial products are subject to market risk. Some financial products, such as currency exchange, are highly speculative and any investment should only be done with risk capital. Prices rise and fall and past performance is no assurance of future performance. This website is an information site only.

Popular

Pages

Expert In

Name*


Message*

Ichimoku indicator analysis of gold for November 7, 2017

Gold price has broken above the 4-hour Kumo (cloud). This is an initial bullish sign but we will need to see confirmation of this strength by breaking previous highs.

analytics5a01642a440b2.png

Red line - price support

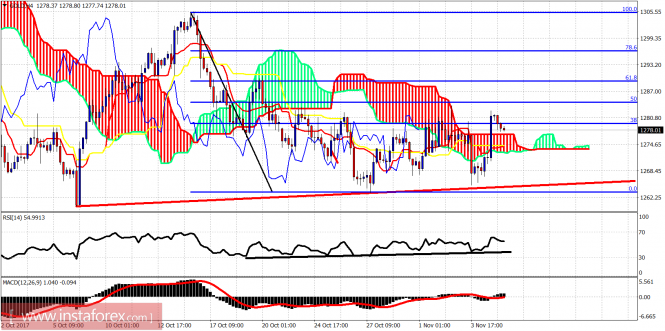
Black line - RSI support

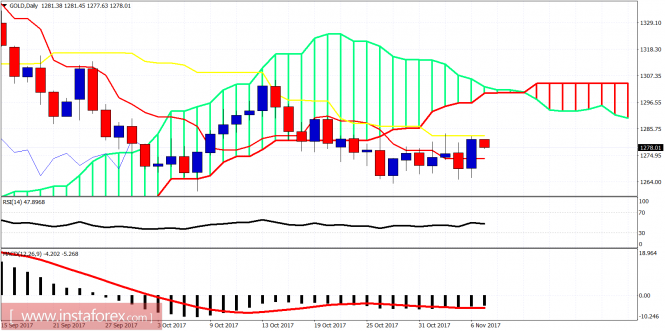
As we mentioned yesterday, the RSI was on top of support and we expected price to bounce as long as the support was not breaking. And this is exactly what happened. Support is at $1,266 and resistance at $1,290. Price has moved above the cloud but needs to stay there and start making higher highs and higher lows.

analytics5a0164ab47969.png

On a daily basis, Gold price has closed above the tenkan-sen (red line indicator) but below the kijun-sen (yellow line indicator) where it got rejected once again. A daily close above the kijun-sen will be a bullish sign and will push Gold price towards the Kumo at $1,295-$1,300. I remain longer-term bullish.The material has been provided by InstaForex Company - www.instaforex.com