
The index is around the 200 SMA on the H1 chart and looks forward to test the resistance zone of 95.14. However, we're expecting corrective moves to take place at this stage and once it breaks below the moving average, USDX is poised to test the support area of 93.97. The MACD indicator remains in the neutral territory calling for sideways.
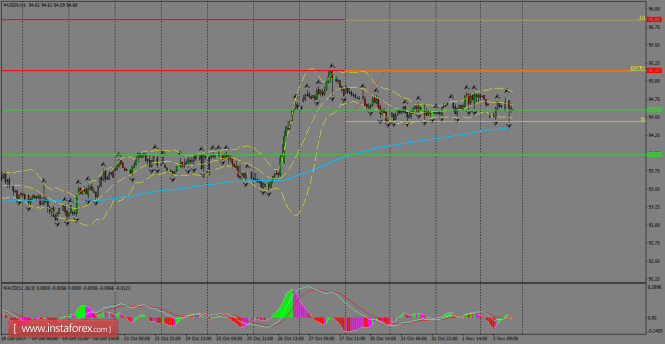
H1 chart's resistance levels: 95.14 / 95.85
H1 chart's support levels: 94.60 / 93.97
Trading recommendations for today: Based on the H1 chart, place buy (long) orders only if the USD Index breaks with a bullish candlestick; the resistance level is at 95.14, take profit is at 95.85 and stop loss is at 94.47.
The material has been provided by InstaForex Company - www.instaforex.com