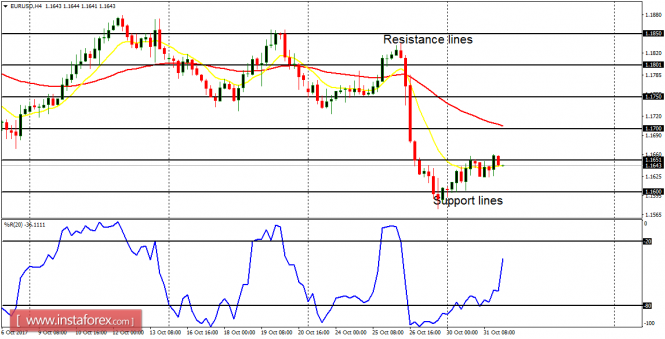
EUR/USD: The EUR/USD is still consolidating in the context of a downtrend. When volatility returns to the market, it would most probably favor bears, for the price is expected to reach the support lines at 1.1600 and 1.1550, which would be tested between today and tomorrow. There is a need for the market to go upwards by at least 200 pips before the current bearish bias can be threatened.
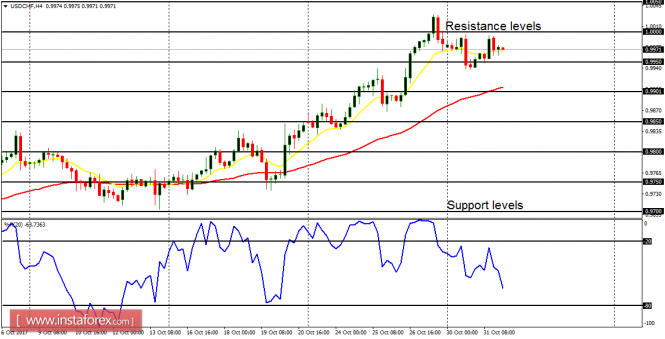
USD/CHF: The pair is still consolidating in the context of an uptrend. When volatility returns to the market, it would most probably favor bulls (price is close to the resistance level at 1.0000, which is a psychological level), for the price is expected to reach the resistance levels at 1.0050 and 1.0100, which would be tested between today and tomorrow. There is a need for the market to go downwards by at least 200 pips before the current bearish bias can be threatened.
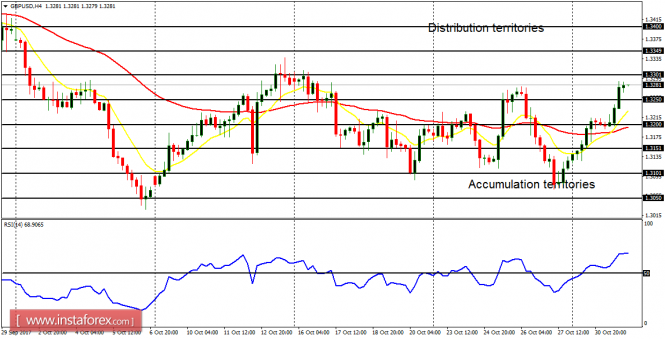
GBP/USD: The GBP/USD has gone upwards by 130 pips this week, creating a bullish signal in the market. Price is above the accumulation territory at 1.3250, going towards the distribution territory at 1.3300 (the first target). Once that territory is breached to the upside, the price would then go towards another distribution territories at 1.3350 and 1.3400.
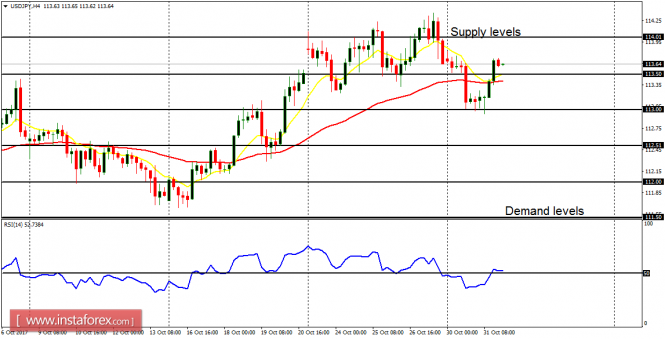
USD/JPY: The signal on this currency trading instrument is essentially bullish. The EMA 11 is above the EMA 56, and the RSI period 14 is above the level 50. This shows that price is more likely to continue going upwards, testing the supply level at 114.00, breaching it to the upside, and then reaching for another supply level at 114.50.
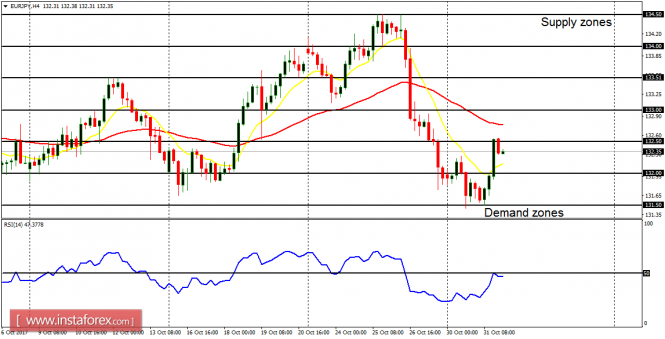
EUR/JPY: The Bearish Confirmation Pattern in the EUR/JPY 4-hour chart is currently in jeopardy, for the rally that has taken place so far in this week is noteworthy enough. Unless the price drops downwards from here, the bearish bias in the market could be rendered invalid, especially when the price goes above the supply zone at 133.50, which would, however, require a strong buying pressure.