
Our first target which we predicted in our previous analysis has been hit. The pair is supported by a bullish trend line since October 20, which confirmed a positive outlook. Both rising 20-period and 50-period moving averages suggest that the prices have a potential for a further upside. The relative strength index is above its neutrality level at 50 and lacks downward momentum.
Therefore, above 0.9820, expect a new challenge with targets at 0.9865 and 0.9900 in extension.
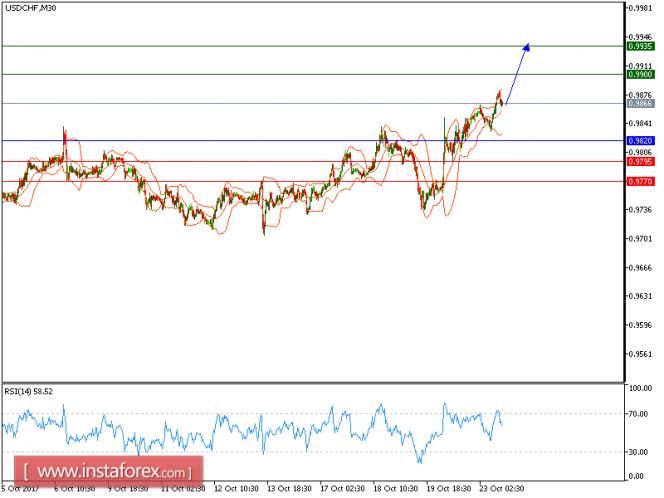
Chart Explanation: The black line shows the pivot point. The present price above the pivot point indicates a bullish position, and the price below the pivot points indicates a short position. The red lines show the support levels and the green line indicates the resistance levels. These levels can be used to enter and exit trades.
Strategy: BUY, Stop Loss: 0.9820, Take Profit: 0.9900
Resistance levels: 0.9900, 0.9935, and 0.9985
Support levels: 0.9795, 0.9770, and 0.9730
The material has been provided by InstaForex Company - www.instaforex.com