
The Gold price got rejected last week and has made a new short-term low below $1,277. Price is making new lows but the RSI is not. The price remains close to the 61.8% Fibonacci retracement of the latest rise but the weekly chart warns that unless we see a swift reversal upwards, we could push lower towards $1,240-50.
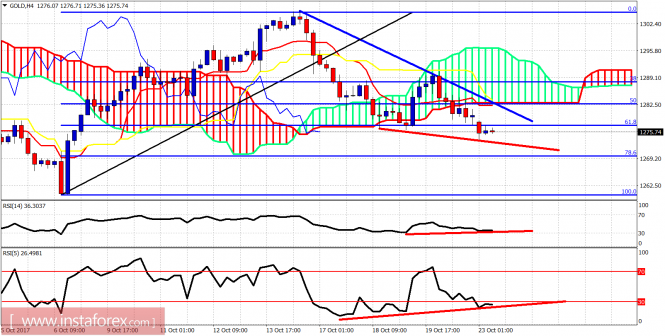
Blue line - resistance
Red lines - bullish divergence signs
The Gold price is trading below the 4 hour Kumo (cloud). This is a bearish sign. However price is still trading around the 61.8% Fibonacci retracement while both RSI indicators warn that the downside is limited and weak and we should expect a bounce higher. Resistance is at $1,283 and next at $1,290. Support is at $1,274.
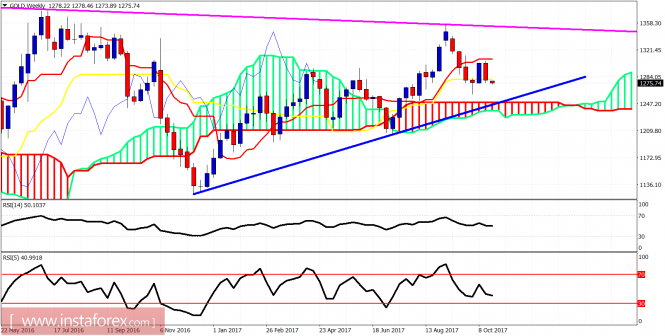
Magenta line - long-term resistance
Blue line - long-term support trend line
The Gold price has closed last week below the kijun-sen (yellow line indicator). Unless we see a reversal this week, there is still a danger of moving towards the weekly Kumo (cloud) at $1,245-50 area. Weekly resistance is at $1,281 and next at $1,307. Support at $1,250.
The material has been provided by InstaForex Company - www.instaforex.com