Global macro overview for 06/10/2017:
The Halifax House Price Index data from the UK were better than expected. Market participants expected a drop from 1.5% a month ago to 0.0% in the reported month, but the reading was at the level of 0.8%. Moreover, on a quarterly basis, the prices increased from 2.6% to 4.0% as well. This means the average UK house price hit 225,109 pounds in September - its highest on record. Nevertheless, the survey cautioned that while house price growth was stronger in September than in the previous months, growth was still weaker than the 6.5% year-on-year change it peaked at in December.
UK house prices continue to be supported by an ongoing shortage of properties for sale and solid growth in full-time employment. Even the recent speculation on the possibility of interest rate hike by the Bank of England did not damp the demand for houses and economists still expect the transaction volumes to hold the current pace even after a rate hike. The only problem for the housing market is increasing pressure on spending power and continuing affordability concerns.
The Halifax House Price Index is the UK's longest running monthly house price series with data covering the whole country going back to January 1983. It is a resumptive index of house prices reflecting prices for new constructions and resale real estate markets.
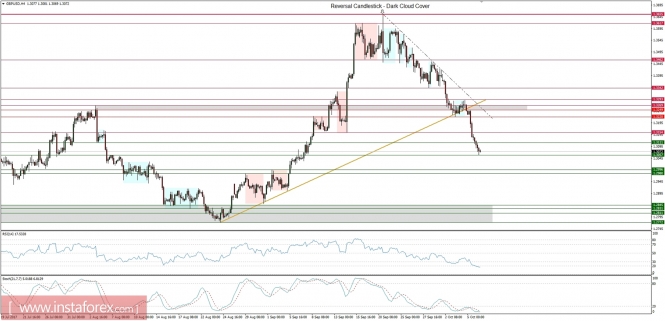
Let's now take a look at the GBP/USD technical picture at the H4 time frame. The market has dropped below 61%Fibo retracement of the previous swing up and is currently trading just above the technical support at the level of 1.3057. The market conditions are oversold, but the momentum indicator still points to the downside. The next technical support is seen at the level of 1.2996 and the nearest resistance is seen at the level of 1.3111