
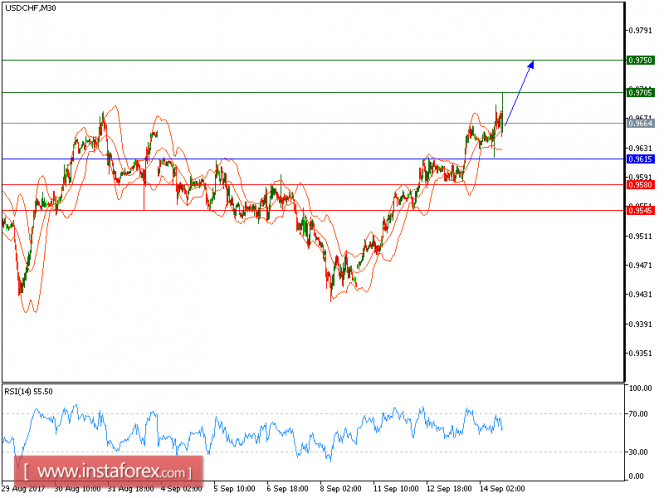
All our upside targets which we predicted in yesterday's analysis has been hit. The pair is trading above its rising 50-period moving average, which plays a support role and maintains the upside bias. The relative strength index is mixed with a bullish bias.
The U.S. Labor Department reported that the producer-price index (PPI) grew 0.2% on month in August, compared with +0.3% expected and -0.1% in July. Investors are closely watching the consumer-price index (CPI) report due later today, which will be tracked by the U.S. Federal Reserve as reference for scheduling the next interest rate rise.
Hence, as long as 0.9605 holds on the downside, a further upside to 0.9660 and even to 0.9705 seems more likely to occur.
Chart Explanation: The black line shows the pivot point. The present price above the pivot point indicates a bullish position, and the price below the pivot points indicates a short position. The red lines show the support levels and the green line indicates the resistance levels. These levels can be used to enter and exit trades.
Strategy: BUY, Stop Loss: 0.9615, Take Profit: 0.9705
Resistance levels: 0.9705, 0.9750, and 0.9800
Support levels: 0.9580, 0.9545, and 0.9500
The material has been provided by InstaForex Company - www.instaforex.com