
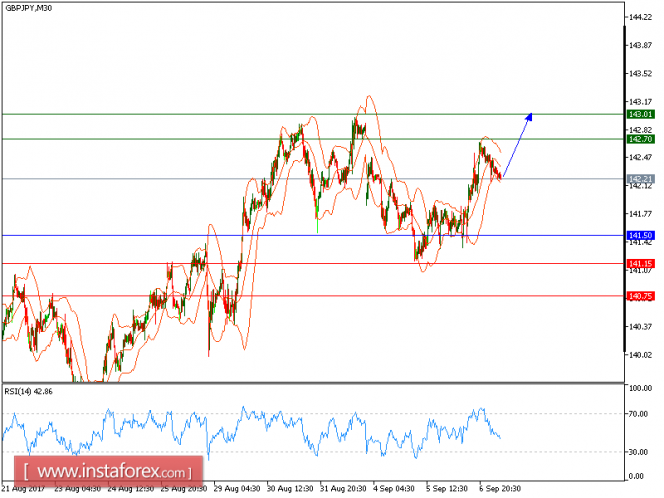
The pair has clearly reversed up, and is likely to post a new rise in the coming trading hours. A bullish cross has been identified between the 20-period and 50-period moving averages (a positive signal). Besides, the relative strength index stands firmly above its neutrality area at 50. Hence, as long as 141.50 is not broken, likely advance to 142.70 and 143.01 in extension.
Alternatively, if the price moves in the direction opposite to the forecast, a short position is recommended above 141.50 with the target at 141.35.
Strategy: BUY, Stop Loss: 141.50, Take Profit: 142.70.
Chart Explanation: the black line shows the pivot point. The price above the pivot point indicates the bullish position; and when it is below the pivot points, it indicates a short position. The red lines show the support levels and the green line indicates the resistance levels. These levels can be used to enter and exit trades.
Resistance levels: 142.70, 143.00, and 143.75
Support levels: 141.15, 140.75, and 140.00
The material has been provided by InstaForex Company - www.instaforex.com