MG Network

something big isHappening!

In the mean time you can connect with us with via:

Copyright © Money Grows Network | Theme By Gooyaabi Templates

Money Grows Network

Archive

Powered by Blogger.

Welcome To Money Grows Network

Verified By

2006 - 2019 © www.moneygrows.net

Investments in financial products are subject to market risk. Some financial products, such as currency exchange, are highly speculative and any investment should only be done with risk capital. Prices rise and fall and past performance is no assurance of future performance. This website is an information site only.

Popular

Pages

Expert In

Name*


Message*

Ichimoku indicator analysis of USDX for September 13, 2017

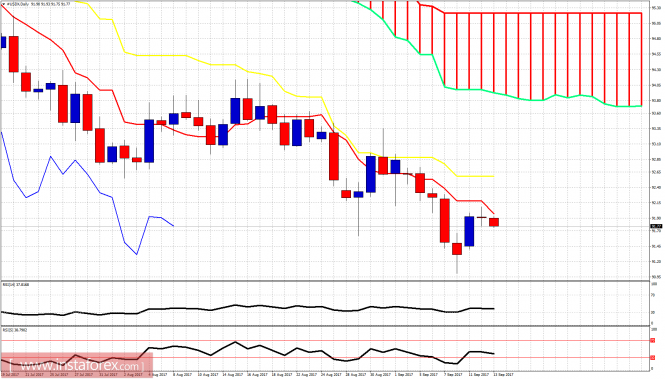
The Dollar index is showing signs of a possible reversal and resumption of the larger bearish trend. Is the bounce in the Dollar index over? Too early to tell and we have to be patient and confirm only on a break below 91.50.

analytics59b8d0ab18c10.png

Black line - short-term support

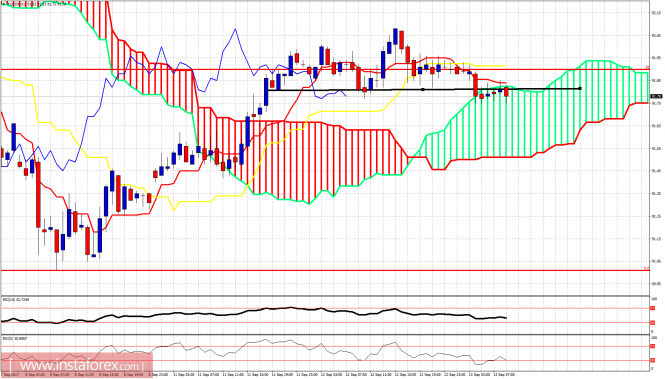
The Dollar index has broken below the short-term neckline of a possible head and shoulders pattern. Key resistance to cancel this pattern is at 91.95. A break above it will open the way for a move higher towards 92.30. Support is now at 91.50.

analytics59b8d12a63059.png

On a daily basis, the Dollar index is clearly in a bearish trend. Price has not managed to break above the tenkan-sen yet. Resistance is at 92. A daily close above 92 could open the way for a move towards 92.60 where we find the kijun-sen resistance (yellow line indicator). For now we still expect that the Dollar index will continue lower towards 90.The material has been provided by InstaForex Company - www.instaforex.com