MG Network

something big isHappening!

In the mean time you can connect with us with via:

Copyright © Money Grows Network | Theme By Gooyaabi Templates

Money Grows Network

Archive

Powered by Blogger.

Welcome To Money Grows Network

Verified By

2006 - 2019 © www.moneygrows.net

Investments in financial products are subject to market risk. Some financial products, such as currency exchange, are highly speculative and any investment should only be done with risk capital. Prices rise and fall and past performance is no assurance of future performance. This website is an information site only.

Popular

Pages

Expert In

Name*


Message*

Ichimoku indicator analysis of gold for September 27, 2017

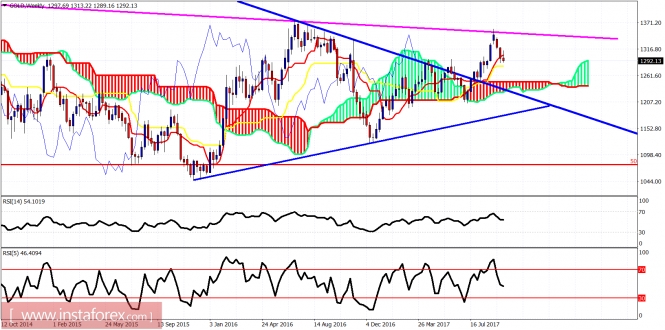
After the rejection in the 4-hour cloud resistance at $1,313, Gold price is now back at its monthly lows. Downside is limited. Price will find support at $1,277. A new low will provide another divergence in the RSI. This is bullish.

analytics59cb4c823e9a7.jpg

Red lines - bearish channel

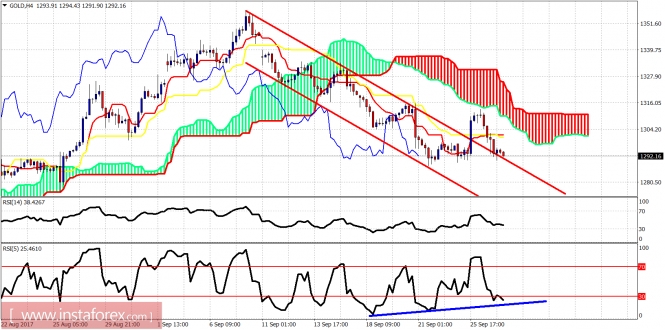
Blue line - bullish divergence

Gold price got rejected by the Kumo yesterday and is back testing the broken bearish channel. Price could make a new low as trend in Ichimoku terms in the 4-hour chart remains bearish. However, a new low is expected not to make a new low in the RSI. This will be a bullish signal, implying that downside is limited.

analytics59cb4ce3ccfa4.jpg

On a weekly basis, Gold price is above the kijun-sen (yellow line indicator). Support is at $1,280. I believe Gold will hold that level. If this level is broken, the weekly downside potential will be at $1,245. Longer-term view and trend for Gold remains bullish. This pullback is considered a buying opportunity.The material has been provided by InstaForex Company - www.instaforex.com