MG Network

something big isHappening!

In the mean time you can connect with us with via:

Copyright © Money Grows Network | Theme By Gooyaabi Templates

Money Grows Network

Archive

Powered by Blogger.

Welcome To Money Grows Network

Verified By

2006 - 2019 © www.moneygrows.net

Investments in financial products are subject to market risk. Some financial products, such as currency exchange, are highly speculative and any investment should only be done with risk capital. Prices rise and fall and past performance is no assurance of future performance. This website is an information site only.

Popular

Pages

Expert In

Name*


Message*

Ichimoku indicator analysis of gold for September 19, 2017

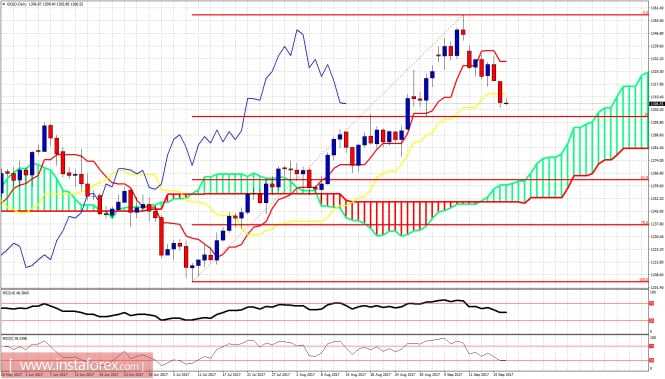
Gold price made new lows very close to our pullback target of $1,300. Short-term trend is bearish. Longer-term trend and my view remain bullish. This is considered a buying opportunity for Gold.

analytics59c0b0c40caa6.jpg

Black lines - bearish channel

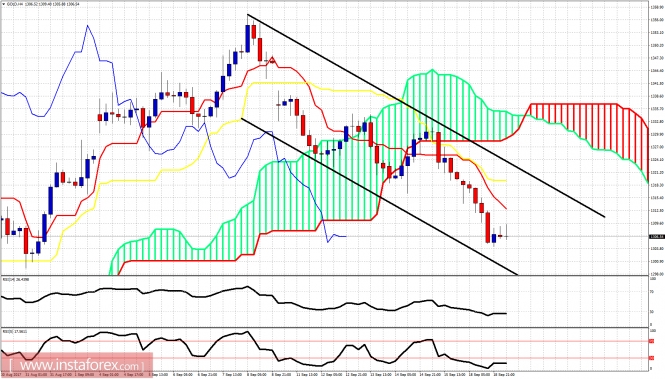
Gold price is trading below the 4-hour Kumo inside the black bearish channel. Price is making lower lows and lower highs on the 4-hour chart. There are signs from the oscillators that we are in oversold territory. Short-term resistance levels for Gold are at $1,319.50, $1,324, $1,329, and $1,334. Support is at $1,300 and $1,290.

analytics59c0b138cc438.jpg

On a daily basis, Gold price is correcting the entire upward move from $1,205. The 38% Fibonacci retracement support is at $1,299. Daily trend remains bullish as price is above the Kumo (cloud). Daily resistance is found at $1,330. A daily close above it will increase the chances of a move towards new highs. I remain longer-term bullish Gold.The material has been provided by InstaForex Company - www.instaforex.com