
Technical outlook:
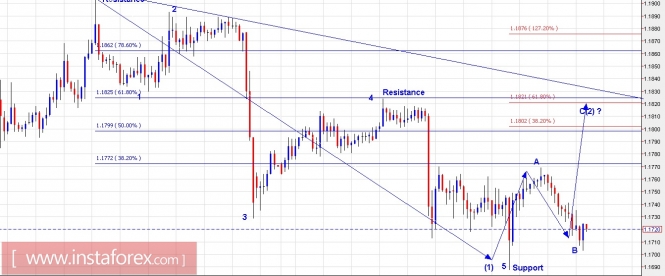
Again, the Wave Principle proves how precise it can be if done properly! The EUR/USD pair prints low at 1.1700 and slightly lower as expected after breaking out of triangle structure as expected, before pulling back sharply. We have presented a short term hourly chart here, which indicates that a counter trend rally is in place now. After 5 waves down, a 3 wave counter trend rally A-B-C is nicely set up. The pair has already completes waves A and B as shown here and is on its way to print wave C higher towards 1.1820/30 levels from here. Immediate support is at 1.1687 levels while resistance is at 1.1830 levels respectively. Also note that resistance trend line would also be passing through the same levels then. Immediate short term structure is to rally and then turn lower again.
Trading plan:
Please buy now for an upside target of 1.1820/30 levels with a stop below 1.1687 levels. Time period 1-2 days. Then turn lower again.
GBP/USD chart setups:
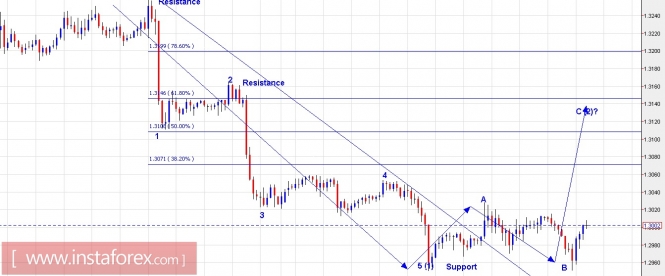
The GBP/USD is no different from EUR/USD as discussed here. The wave principle and counts suggest that it has completed 5 waves (impulse) lower, from 1.3267 through 1.2950 levels earlier. As depicted on the hourly chart here, the pair has drifted sideways for 2 days and is unfolding as a flat at this moment in time. The wave structure from 1.2950 is A-B and each wave sub divides into 3 waves. The next high probability wave should be on the north side, and sub divides into 5 waves, hence competing for a 3-3-5 corrective wave. Immediate resistance is seen at 1.3060 levels, while support is at 1.2950 levels respectively. If the above counts hold true, GBPUSD is looking to push higher towards 1.3140 levels from here, before turning lower again.
Trading plan:
Please remain long for now, with a stop below 1.2950 levels, targeting 1.3140 levels. Time frame 1-2 days, then turn lower again.
Fundamental outlook:
Watch out for MXN Monetary Policy Rate Decision around 0200 PM EST today.
Good luck!
The material has been provided by InstaForex Company - www.instaforex.com