
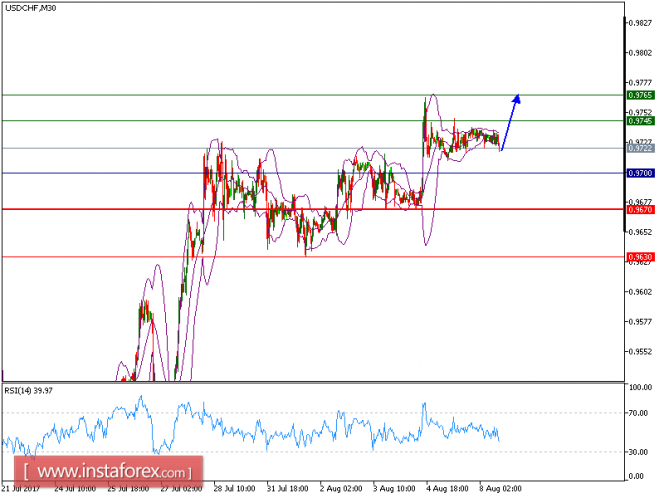
USD/CHF is expected to trade with a bullish outlook. The pair posted a rebound and broke above both 20-period and 50-period moving averages. The relative strength index has landed on its neutrality level at 50 and is turning up. The downside potential should be limited by the key support at 0.9700.
Therefore, as long as this key level holds on the downside, look for a further upside to 0.9745 and even to 0.9765 in extension.
Chart Explanation: The black line shows the pivot point. The present price above the pivot point indicates the bullish position and below the pivot points indicates the short position. The red lines show the support levels and the green line indicates the resistance levels. These levels can be used to enter and exit trades.
Strategy: BUY, Stop Loss: 0.9700, Take Profit: 0.9745
Resistance levels: 0.9745, 0.9765, and 0.9780
Support levels: 0.9670, 0.9630, and 0.9600
The material has been provided by InstaForex Company - www.instaforex.com