MG Network

something big isHappening!

In the mean time you can connect with us with via:

Copyright © Money Grows Network | Theme By Gooyaabi Templates

Money Grows Network

Archive

Powered by Blogger.

Welcome To Money Grows Network

Verified By

2006 - 2019 © www.moneygrows.net

Investments in financial products are subject to market risk. Some financial products, such as currency exchange, are highly speculative and any investment should only be done with risk capital. Prices rise and fall and past performance is no assurance of future performance. This website is an information site only.

Popular

Pages

Expert In

Name*


Message*

Technical analysis of USD/CAD for August 2, 2017

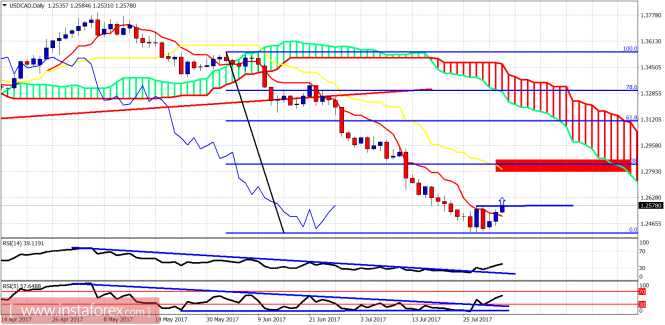
The USD/CAD confirmed the bullish reversal yesterday as price made a higher low and earlier today broke above recent high at 1.2575. The trend is bullish as the price is making higher highs and higher lows.

analytics5981814cf399e.png

Blue line - recent high (taken out)

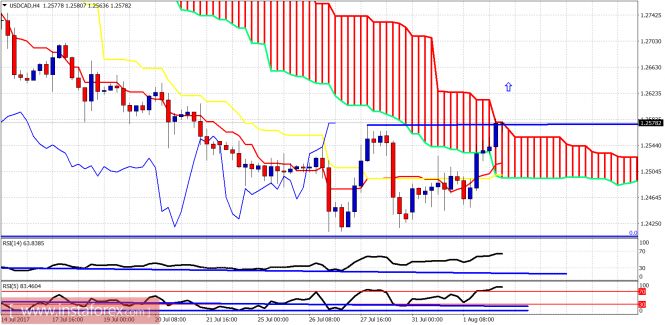
The USD/CAD made a double bottom (higher low slightly) and reversed upwards to break 1.2575. The risk reward around 1.2450 was favoring the bullish scenario as Oil was making new highs while USD/CAD was not making new lows. We previously had noted that the RSI indicators showed reversal signs.

analytics5981819e607f4.png

On a daily basis, the RSI has broken out of the wedge pattern and has given a bullish signal. Price is now respecting this signal and is trying to break above 1.26. The 38% Fibonacci retracement is now at 1.28 so this is our target. Support is at 1.2495 so a break below it will not be a good sign for bulls.The material has been provided by InstaForex Company - www.instaforex.com