Gold price made a new high yesterday but prices soon after pulled back inside near the lows of the day just above $1,262. The trend remains bullish but maybe it is time for a pull back. Our short-term minimum target has been achieved. For gold to break above $1,300 we will need a pull back first.
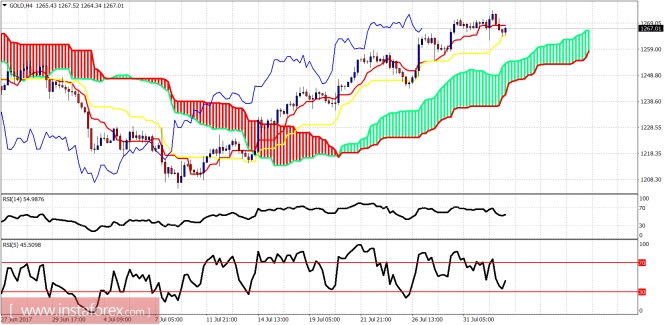
In the 4-hour chart, as shown above, the price remains above the kijun-sen (yellow line indicator) confirming a bullish short-term trend. Support is at $1,263 and next at the Kumo (cloud) at $1,250. This is our minimum pull back target area.
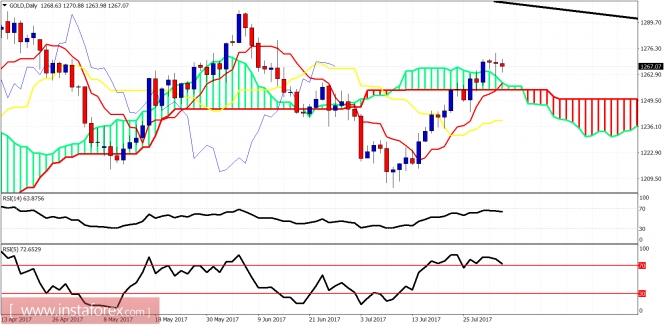
On a daily basis, Gold price has broken above the daily Kumo (cloud) resistance and this is a bullish sign. However, with the RSI (5) at overbought levels, we could expect a pull back towards cloud support for a back test of the breakout. We remain longer-term bullish.The material has been provided by InstaForex Company -
www.instaforex.com
