
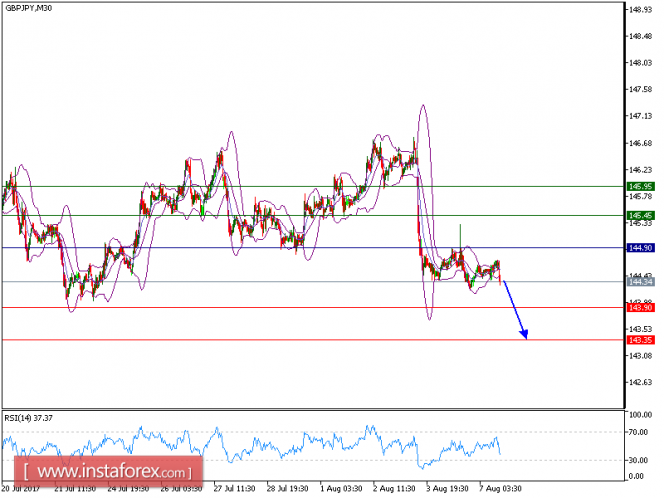
GBP/USD is under pressure. The pair recorded lower tops and lower bottoms, which confirmed a negative outlook. The downward momentum is further reinforced by the declining 50-period moving average. The relative strength index is capped by a descending trend line.
Hence, as long as 144.90 holds on the upside, a new drop to 143.90 and even to 143.35 seems more likely to occur.
Alternatively, if the price moves in the opposite direction as predicted, a long position is recommended above 144.90 with the target at 145.45.
Strategy: SELL, Stop Loss: 144.90, Take Profit: 143.90.
Chart Explanation: the black line shows the pivot point. The price above the pivot point indicates the bullish position and when it is below the pivot points, it indicates a short position. The red lines show the support levels and the green line indicates the resistance levels. These levels can be used to enter and exit trades.
Resistance levels: 145.45, 145.95, and 146.60
Support levels: 143.90, 143.35, and 142.75.
The material has been provided by InstaForex Company - www.instaforex.com