
Upside movements are expected to prevail in GBP/JPY. The pair managed to break above its intraday horizontal level at 130.95 yesterday. The previous key resistance now acts as a strong support, which should limit any downside room. In addition, formation of higher highs and lows remains intact, which should confirm a bullish outlook.
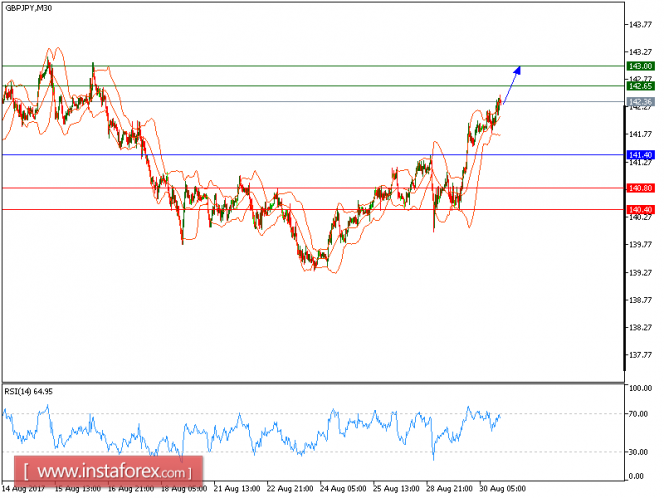
To sum up, as long as 141.40 is not broken, look for a new rise to 142.65 and 143.00 in extension.
Alternatively, if the price moves in the direction opposite to the forecast, a short position is recommended below 141.40 with the target at 140.80.
Strategy: BUY, Stop Loss: 141.40, Take Profit: 142.65.
Chart Explanation: the black line shows the pivot point. The price above the pivot point indicates the bullish position; and when it is below the pivot points, it indicates a short position. The red lines show the support levels and the green line indicates the resistance levels. These levels can be used to enter and exit trades.
Resistance levels: 142.65, 143.00, and 143.50
Support levels: 140.80, 140.40, and 140.00
The material has been provided by InstaForex Company - www.instaforex.com