
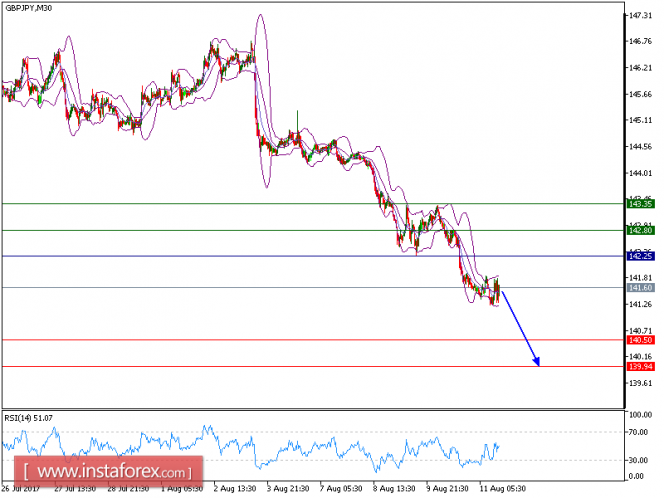
All our targets, which we predicted in yesterday's analysis, have been hit. The pair is still under pressure and recorded a succession of lower tops and lower bottoms since Aug 10, which confirms a negative view. The declining 20-period and 50-period moving averages maintain the downside bias. The relative strength index is below its neutrality level at 50 and lacks upward momentum. In addition, 142.25 is playing a key resistance role, which should limit the upside potential.
As long as this key level holds on the upside, look for a further drop towards 140.50 and even 139.95 in extension.
Alternatively, if the price moves in the opposite direction as predicted, a long position is recommended above 142.25 with the target at 142.80.
Strategy: SELL, Stop Loss: 142.25, Take Profit: 140.50.
Chart Explanation: the black line shows the pivot point. The price above the pivot point indicates the bullish position; and when it is below the pivot points, it indicates a short position. The red lines show the support levels and the green line indicates the resistance levels. These levels can be used to enter and exit trades.
Resistance levels: 142.80, 143.35, and 144.35
Support levels: 140.50, 139.95, and 140.65.
The material has been provided by InstaForex Company - www.instaforex.com