
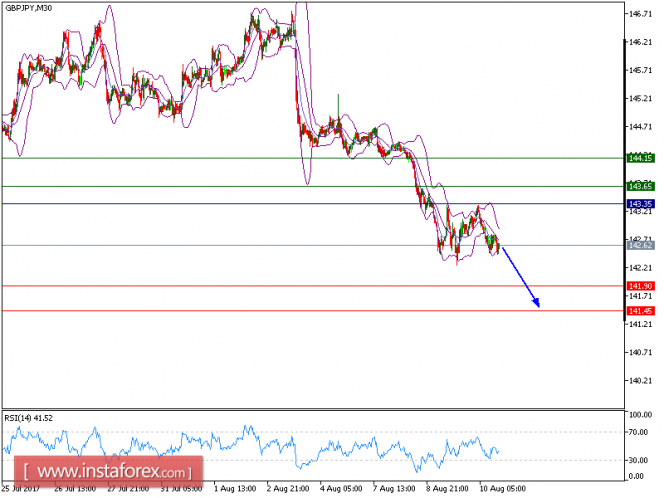
We retain our yesterday's bearish outlook for GBP/JPY. The pair is trading in a lower range and is still expected to post some further downside moves. The relative strength index is around its neutrality level at 50 and lacks downward momentum. Nevertheless, 143.35 is playing a key resistance role, which should limit the upside potential.
As long as this key level at 143.35 is not broken, the pair is likely to test the next support at 141.90. A break below this level would call for a further decline towards 141.45.
Alternatively, if the price moves in the opposite direction as predicted, a long position is recommended above 143.35 with the target at 143.65.
Strategy: SELL, Stop Loss: 143.35, Take Profit: 143.35.
Chart Explanation: the black line shows the pivot point. The price above the pivot point indicates the bullish position and when it is below the pivot points, it indicates a short position. The red lines show the support levels and the green line indicates the resistance levels. These levels can be used to enter and exit trades.
Resistance levels: 143.65, 144.15, and 144.35
Support levels: 141.90, 141.45, and 140.65.
The material has been provided by InstaForex Company - www.instaforex.com