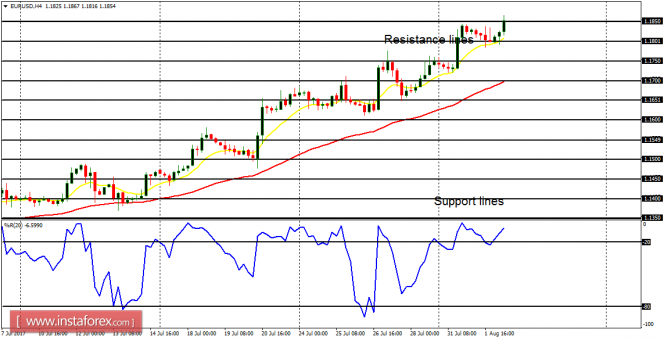
EUR/USD: The EUR/USD has continued its bullish journey this week, and it is currently testing the resistance line at 1.1850. The resistance line would soon be breached to the upside, owing to the Bullish Confirmation Pattern in the 4-hour chart, and the price would then target another resistance line at 1.1900.
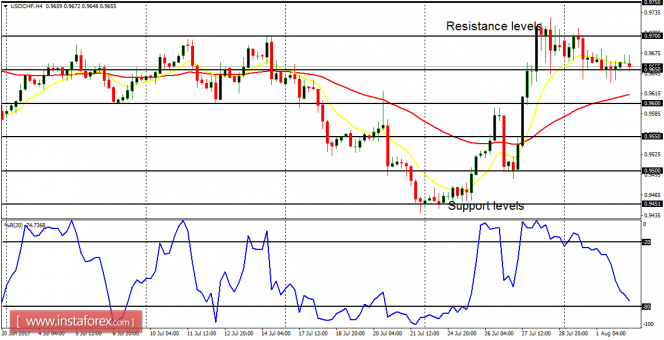
USD/CHF: The USD/CHF went sideways on Monday and Tuesday, while the bullish signal that was generated last week is still intact. As long as CHF is weak, the bullish signal in the market would be sustained. While the resistance level at 0.9700 could be tested once again, the market would go seriously south in case CHF gains stamina.
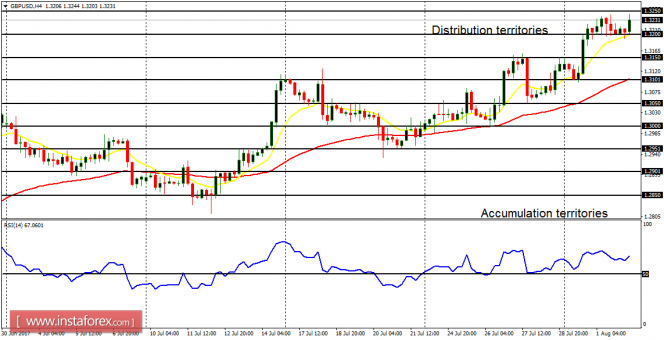
GBP/USD: The movement on the Cable is almost similar to the movement on the EUR/USD (they are both positively correlated). The market has gone upwards this week, moving above the accumulation territory at 1.3200 and targeting the distribution territory at 1.3250. As long as the EUR/USD is strong, the Cable may also manage to go north.
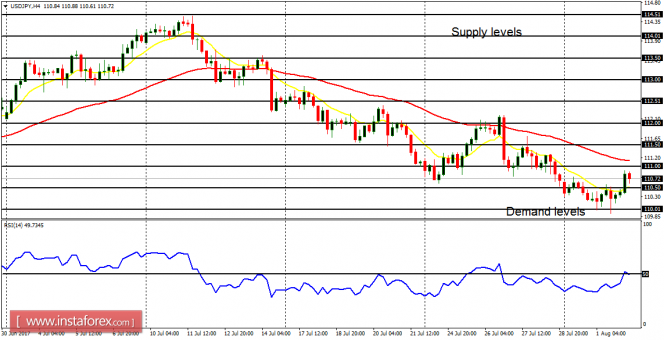
USD/JPY: This currency trading instrument tested the demand level at 110.00 and then bounced upwards. The upward bounce is shallow and it may signal another bearish effort. The bias on this market is bearish and the EMA 11 is below the EMA 56. Further downwards movement is anticipated, which would enable price to go below the demand level at 110.00 (which has been previously tested).
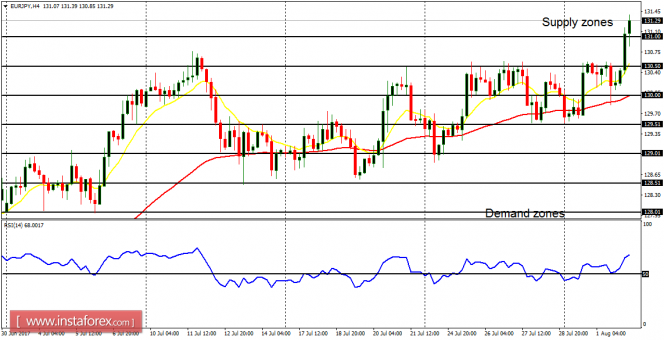
EUR/JPY: This cross has gone above the demand zone at 130.50 and 131.00. This action has ended the recent neutrality on the market, and there is now a Bullish Confirmation Pattern in the chart. The next targets for bulls are located at the supply zones at 131.50 and 132.00. However, there is also a risk of a pullback along the way.