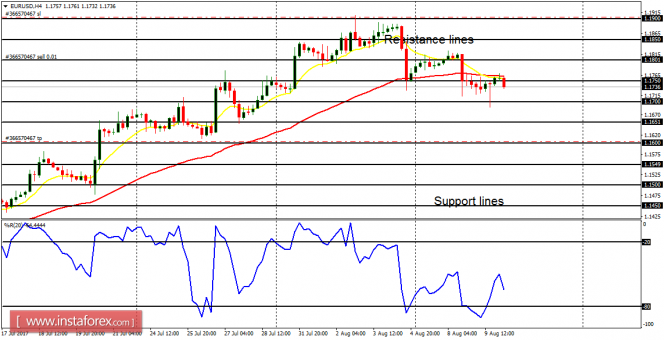
EUR/USD: There remains a bullish bias on the market, though the bias is now under threat (owing to an ongoing medium-term consolidation in the market)A movement of about 200 pips to the downside would result in a bearish bias, while a movement of about 100 pips from here would emphasize the extent bullish bias.
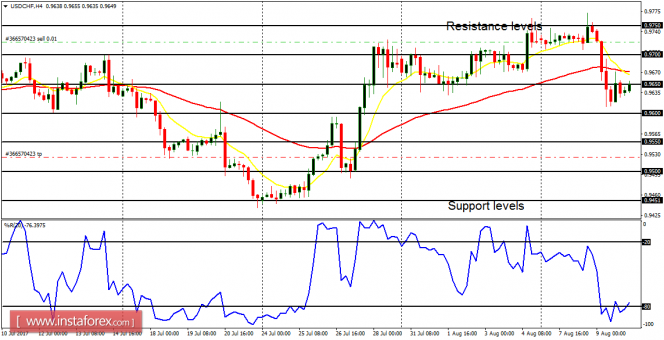
USD/CHF: This pair went sideways on Monday and Tuesday; managed to test the resistance level at 0.9750 and the dropped below the resistance level at 0.9700. The drop has created a bearish signal, which is supposed to continue as price goes further downwards, reaching the support levels at 0.9600 and 0.9550.
GBP/USD: There is a Bearish Confirmation Pattern in the GBP/USD 4-hour chart. Price has moved lower this week and it is currently consolidating in the context of a downtrend. Following the consolidation, there would be another leg of a bearish journey, which would enable price to test the accumulation territories at 1.2950 and 1.2900.

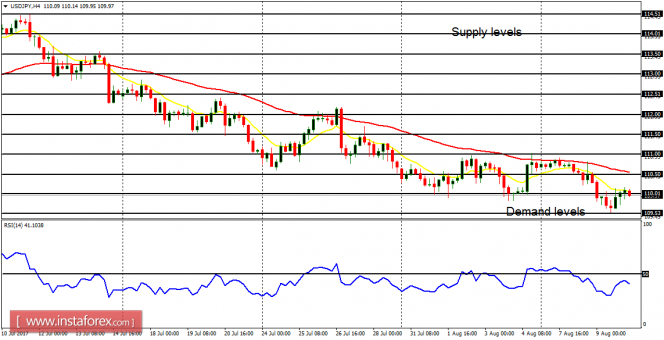
USD/JPY: The USD/JPY is currently a bear market – which is supposed to continue its weakness. The outlook on JPY pairs remains bearish and the price would test the demand levels at 109.50, 109.00 and 108.50 within the next few trading days. Some fundamental figures are expected today and they may have an impact on the market.
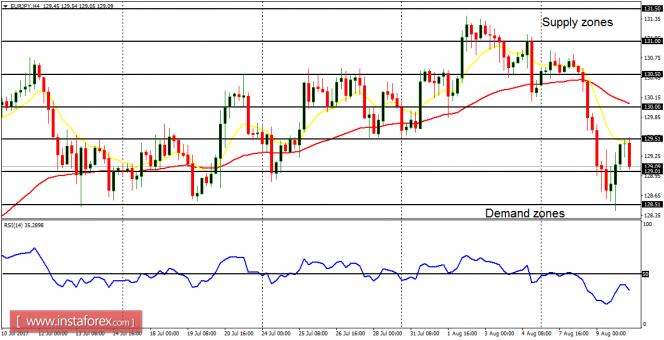
EUR/JPY: This cross lost about 200 pips this week, testing the demand zone at 128.50, before the current volatility and weak bullish effort. The EMA 11 is below the EMA 56, and the RSI period 14 is below the level 50. There is a Bearish Confirmation Pattern in the market, which means further weakness is anticipated.