
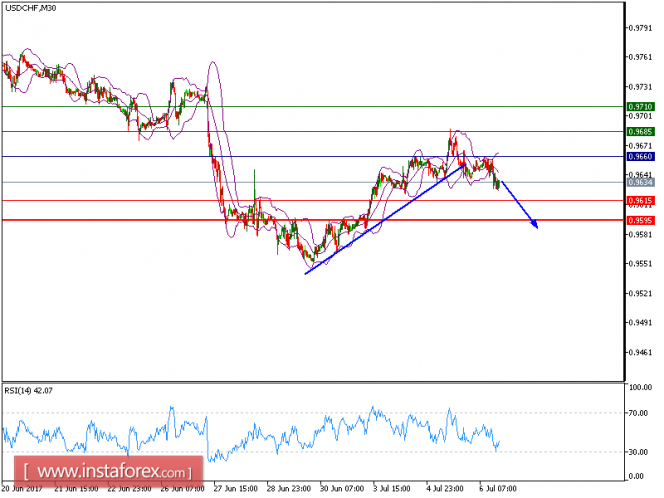
The pair recorded lower tops and lower bottoms since July 5, which confirmed a negative outlook. The 20-period moving average crossed below the 50-period one. The relative strength index is bearish and is calling for a further downside. Besides, the Federal Reserve's latest meeting minutes showed that officials are planning to gradually shrink the central bank's balance sheet.
Therefore, below 0.9660, look for a new decline to 0.9615 and even to 0.9595 in extension.
Chart Explanation: The black line shows the pivot point; the present price above pivot point indicates the bullish position and below pivot points indicates the short position. The red lines show the support levels and the green line indicates the resistance levels. These levels can be used to enter and exit trades.
Strategy: SELL, Stop Loss: 0.9660, Take Profit: 0.9614
Resistance levels: 0.9685, 0.9710, and 0.9740
Support levels: 0.9615, 0.9595, and 0.9545
The material has been provided by InstaForex Company - www.instaforex.com