
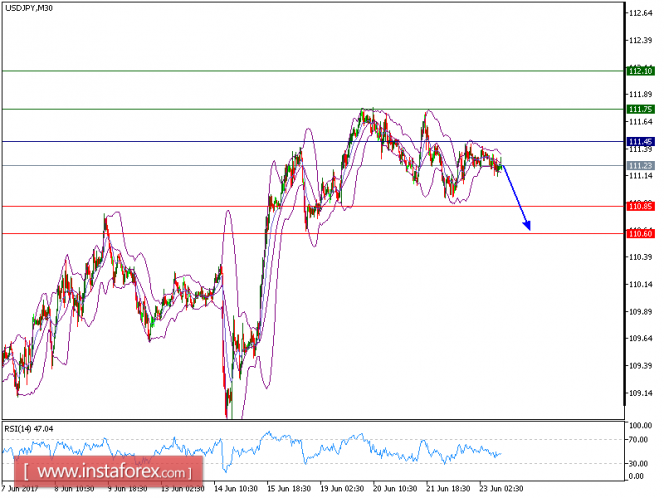
We will retain our yesterday's target of USD/JPY. Although the pair posted a rebound and broke above the 50-period moving average, it is still trading below the key resistance at 111.45 (the low of June 22), which should limit the upside potential. The relative strength index is mixed with bearish bias.
Hence, as long as 111.45 is not surpassed, look for a further drop to 110.80 and even to 110.60 in extension.
Alternatively, if the price moves in the opposite direction as predicted, a long position is recommended above 111.45 with targets at 111.75 and 112.10.
Chart Explanation: The black line shows the pivot point. The present price above pivot point indicates the bullish position while the price below pivot point indicates the short position. The red lines show the support levels and the green line indicates the resistance levels. These levels can be used to enter and exit trades.
Strategy : BUY, Stop Loss: 111.15, Take Profit: 112.10
Resistance levels: 111.75, 112.10, and 112.50
Support levels: 110.85,110.60, and 110.35
The material has been provided by InstaForex Company - www.instaforex.com