
Monthly Outlook
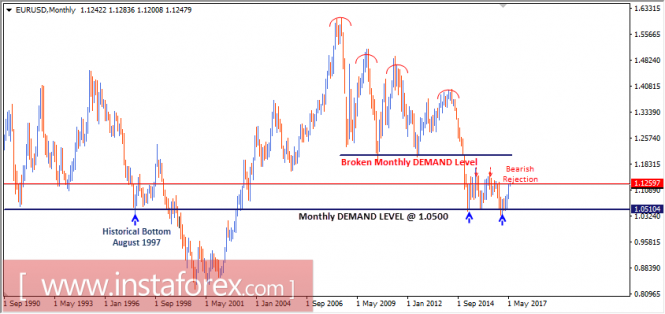
In January 2015, the EUR/USD pair moved below the major demand levels near 1.2100 (Multiple previous bottoms set in July 2012 and June 2010). Hence, a long-term bearish target is projected toward 0.9450.
In March 2015, EUR/USD bears challenged the monthly demand level around 1.0500, which had been previously reached in August 1997.
In the longer term, the level of 0.9450 remains a projected target if any monthly candlestick achieves bearish closure below the depicted monthly demand level of 1.0500.
Otherwise, the EUR/USD pair remains trapped within the depicted consolidation range (1.0500-1.1260).
Daily Outlook
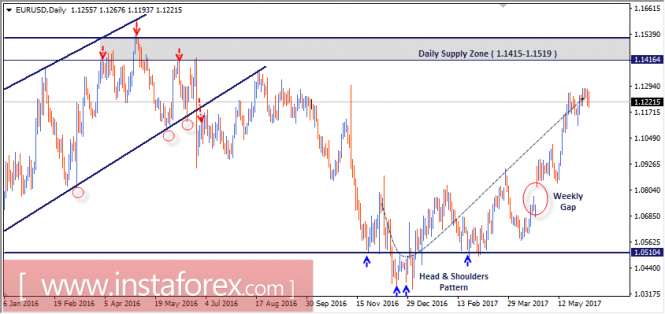
In January 2017, the previous downtrend was reversed when a Head and Shoulders pattern was established around 1.0500. Since then, evident bullish momentum has been expressed on the chart.
The next daily supply level to meet the EUR/USD pair is located between (1.1400-1.1520) where price action should be watched for possible bearish rejection.
Recent Update: The price levels around 1.1270-1.1285 constitute Intraday resistance where some bearish pullback is being expressed.
Bullish breakout above 1.1285 is needed to allow further bullish advance towards 1.1400.
Trade recommendations:
The EUR/USD pair remains bullish initially towards 1.1400 unless evident signs of bearish rejection are expressed earlier on the chart.
A valid SELL Entry can be considered at the depicted supply zone (1.1400 up to 1.1520) especially if signs of bearish rejection are expressed.
S/L should be placed above 1.1550 while T/P levels should be placed at 1.1100, 1.1020 and 1.0850.
The material has been provided by InstaForex Company - www.instaforex.com