MG Network

something big isHappening!

In the mean time you can connect with us with via:

Copyright © Money Grows Network | Theme By Gooyaabi Templates

Money Grows Network

Archive

Powered by Blogger.

Welcome To Money Grows Network

Verified By

2006 - 2019 © www.moneygrows.net

Investments in financial products are subject to market risk. Some financial products, such as currency exchange, are highly speculative and any investment should only be done with risk capital. Prices rise and fall and past performance is no assurance of future performance. This website is an information site only.

Popular

Pages

Expert In

Name*


Message*

Ichimoku indicator analysis of gold for June 22, 2017

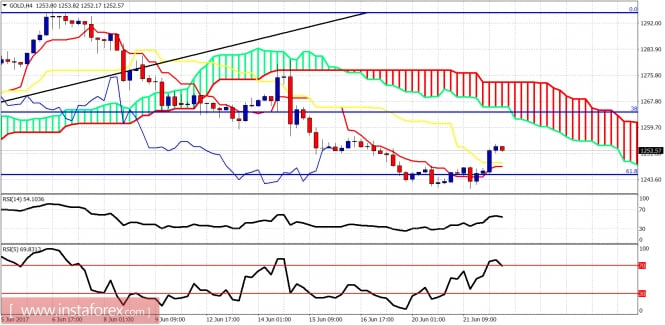
Gold price bounced off the 61.8% Fibonacci retracement and the $1,245-40 area as expected. Price should test the $1,260 short-term resistance area. A rejection there will open the way for a push towards $1,200, but if the week closes around $1,260 and higher, we could have a bullish reversal sign on a weekly basis.

analytics594b69da3592d.jpg

Gold price is trading above both the tenkan- and kijun-sen but below the 4-hour Kumo. Price needs to break above $1,260-70 cloud area to turn short-term trend to bullish. First important short-term resistance is at $1,260. Support is at $1,241 and if broken we could see $1,230. However I believe downside is limited....a bounce higher is what we should focus in the short term.

analytics594b6a9cb071d.jpg

Black line - long-term resistance

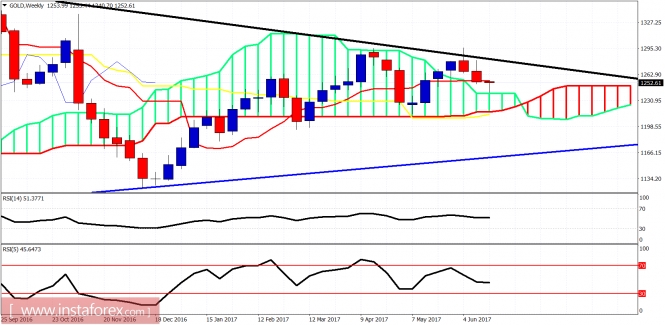
Blue line - long-term support

Gold weekly chart could shape up to be a very bullish one as the candle formation of this week touched the weekly Kumo (cloud) support as expected and bounced higher. This long-tailed candle is a bullish reversal sign and will strengthen the higher we close this week. I'm short-term and longer-term bullish about Gold.

The material has been provided by InstaForex Company - www.instaforex.com