MG Network

something big isHappening!

In the mean time you can connect with us with via:

Copyright © Money Grows Network | Theme By Gooyaabi Templates

Money Grows Network

Archive

Powered by Blogger.

Welcome To Money Grows Network

Verified By

2006 - 2019 © www.moneygrows.net

Investments in financial products are subject to market risk. Some financial products, such as currency exchange, are highly speculative and any investment should only be done with risk capital. Prices rise and fall and past performance is no assurance of future performance. This website is an information site only.

Popular

Pages

Expert In

Name*


Message*

Ichimoku indicator analysis of gold for June 14, 2017

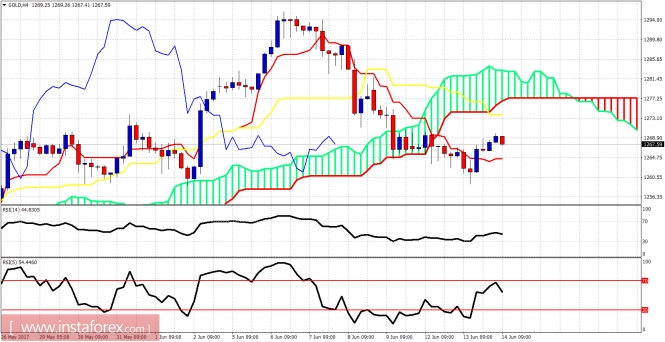
Gold price is bouncing as expected after breaking out of the bearish short-term channel. The trend remains bearish but we could already have completed the entire correction and the next leg up towards $1,400 starting now. It is important to hold the recent low at $1,259.

analytics5940e0beec7f7.jpg

Gold price is trading below the Ichimoku cloud on the 4 hour chart. The trend remains bearish but there is an initial reversal off $1,259. Could the entire correction be over?we will know if we break above $1,295. Until then the $1,259 low is important for the short-term view. If it is broken, the price may go to $1,250-45. Short-term resistance by the Kumo is found at $1,277.

analytics5940e16b9f223.jpg

Red line - medium-term support

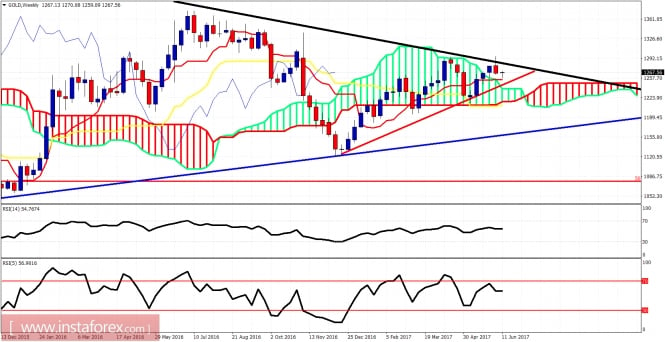
Blue line- long-term support

Black line - long-term resistance

The weekly chart remains slightly bullish as the price is above the weekly Kumo. However, we need to be cautious as the price is still below the long-term black trend line resistance. Holding above the red trend line is a good sign and I do not expect to break it. I was expecting to touch the weekly cloud but it is not necessary. My long-term view remains bullish even if we dip to $1,240-$1,200.

The material has been provided by InstaForex Company - www.instaforex.com