MG Network

something big isHappening!

In the mean time you can connect with us with via:

Copyright © Money Grows Network | Theme By Gooyaabi Templates

Money Grows Network

Archive

Powered by Blogger.

Welcome To Money Grows Network

Verified By

2006 - 2019 © www.moneygrows.net

Investments in financial products are subject to market risk. Some financial products, such as currency exchange, are highly speculative and any investment should only be done with risk capital. Prices rise and fall and past performance is no assurance of future performance. This website is an information site only.

Popular

Pages

Expert In

Name*


Message*

Ichimoku indicator analysis of gold for June 1, 2017

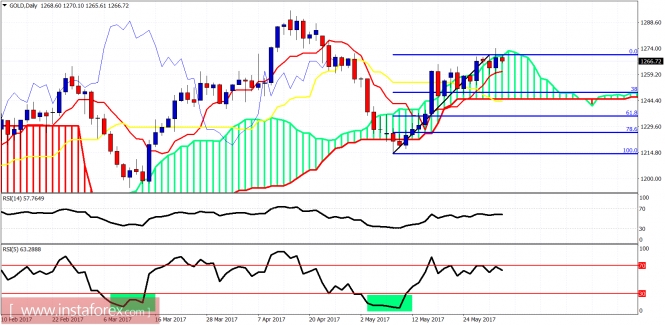
Gold price has reached the upper trading range boundary resistance and is pulling back down. Short-term traders could try and profit from short positions with tight stops at $1,275 as a pullback towards the lower boundary level is justified.

analytics592fbd12e8cac.jpg

Blue lines - trading range

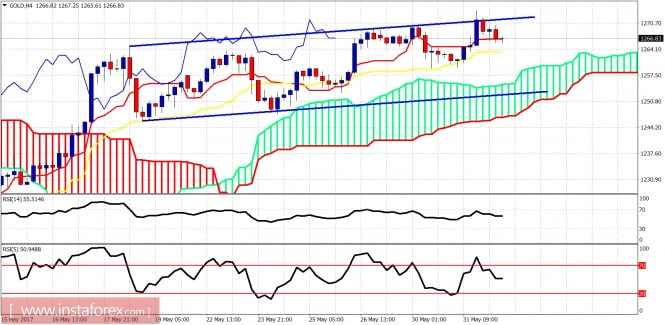
Gold price got rejected at the upper blue trading range boundary. Price remains above both the tenkan- and kijun-sen indicators. Trend remains bullish. As said in previous posts, we could see a slow grind higher but overall I expect price to pull back towards $1,255.

analytics592fbd5f94c91.jpg

Gold price remains inside the daily Kumo (cloud). Trend is neutral. Price is expected to pull back at least towards the lower cloud boundary and just below the 38% Fibonacci retracement around $1,244. My longer-term view remains bullish but I do not see the bullish breakout to happen soon.The material has been provided by InstaForex Company - www.instaforex.com