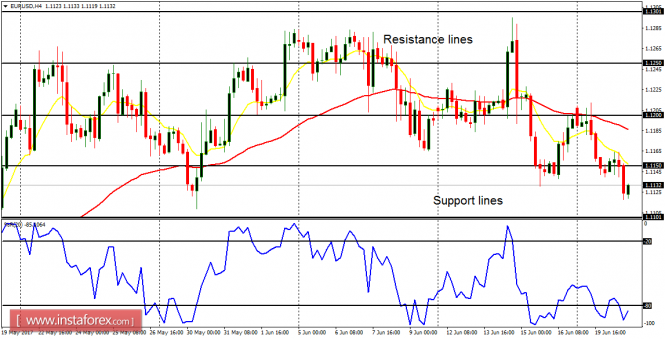
EUR/USD: A bearish signal has appeared on the EUR/USD, which has led to a Bearish Confirmation Pattern in the 4-hour chart. This is according to the anticipated movement for the week, and further downwards movement is possible, as price goes towards the support lines at 1.1100 and 1.1050.
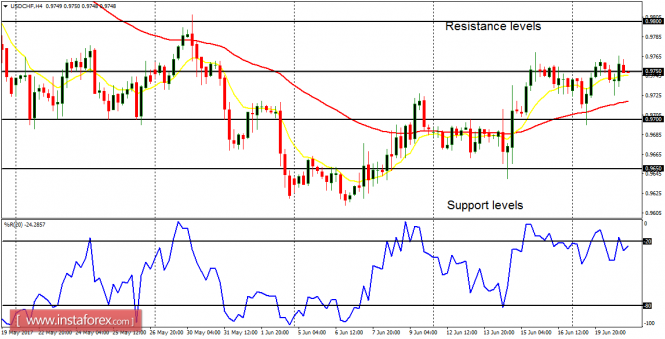
USD/CHF: A bullish signal has appeared on the USD/CHF, which has led to a Bullish Confirmation Pattern in the 4-hour chart. This is according to the anticipated movement for the week, and further upwards movement is possible, as price goes towards the resistance levels at 0.9570 and 0.9800.
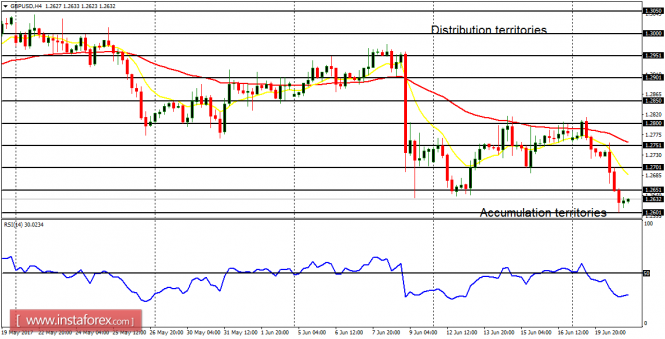
GBP/USD: The Cable has dropped about 160 pips this week, and it is now below the distribution territory at 1.2650; going towards the accumulation territory at 1.2600 (the initial target). The next target after that would be the accumulation territory at 1.2550, which could be reached before the end of the week.
USD/JPY: Despite the shallow pullback witnessed in this market, its short-term bullishness remains valid. The EMA 11 is above the EMA 56, and the RSI period 14 is above the level 50. Price may endeavor to go further upwards before the well-anticipated bearish run happens in the market.

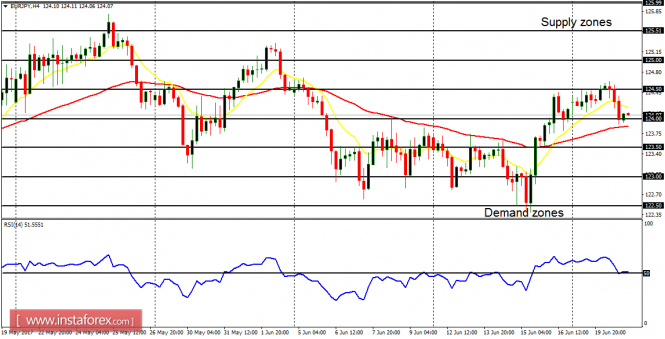
EUR/JPY: This currency trading instrument is in a precarious situation. There are mixed signals in the market. The RSI period 14 has crossed the level 50 to the upside, giving a bearish signal; whereas the EMA 11 remains above the EMA 56. When the price goes below the demand zone at 123.00, a clean bearish signal would have been generated.