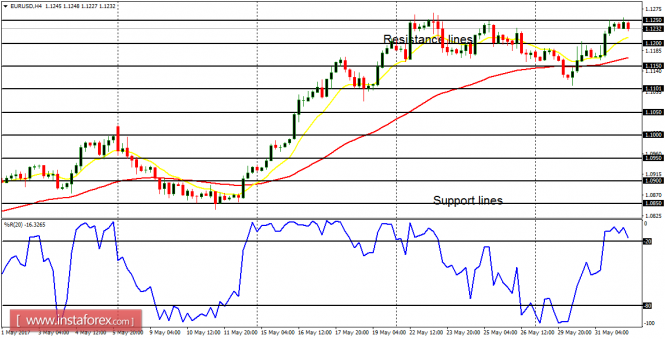
EUR/USD: The EUR/USD pair went upwards to test the resistance line at 1.1250 several times, but unable to break it to the upside. The resistance line would eventually be broken, as price targets another resistance line at 1.1300. Some fundamental reports due later today and they will make an impact on the market.
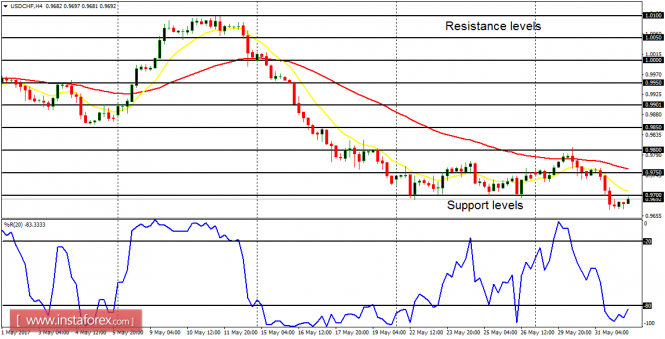
USD/CHF: The shallow bullish effort on this pair was quickly rejected once it tested the resistance level at 0.9800 (in the context of a downtrend). Price has dropped 120 pips since then, now below the resistance level at 0.9700. A further bearish movement is possible, especially as long as the EUR/USD pair goes upwards. The EUR/USD pair could eventually go downwards, and that is when USD/CHF would rally.
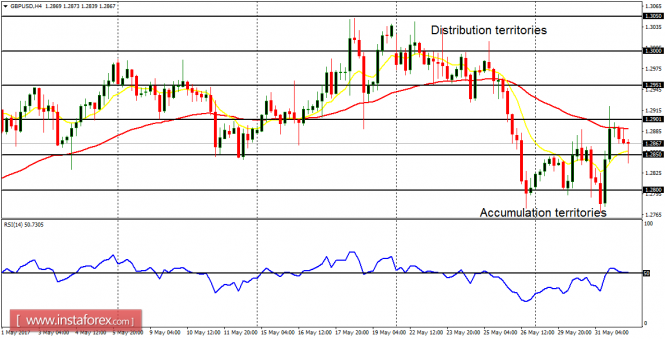
GBP/USD: The Cable has become a very volatile market with no clear direction in the short term. The EMAs 11 and 56, and the RSI period 14, are giving a conflicting signals. Thus, it is OK to stay away from the market right now, until there is a clear directional movement, which would be established before the end of this week or early next week.
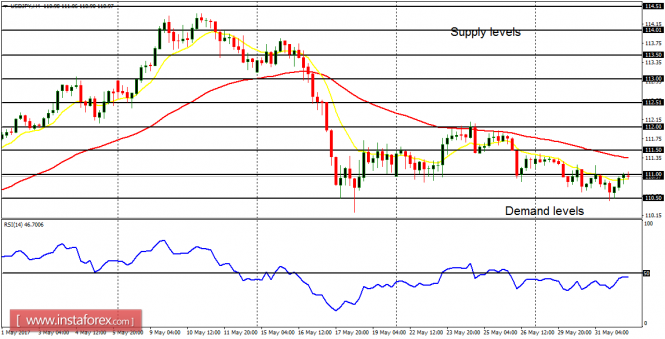
USD/JPY: This is a short-term bear market, though the market has not gone seriously downwards this week. The EMA 11 is below the EMA 56, and the RSI period 14 is below the 50 level. Given the bearish expectation on the JPY pairs for this week and the month of June 2017, the pair is supposed to continue going downwards when momentum returns to the market.
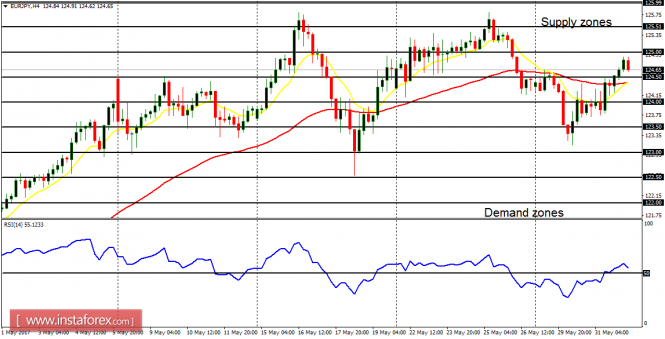
EUR/JPY: This cross went upwards yesterday, and this has almost generated a new "buy" signal on the 4-hour chart. The EMA 11 has almost crossed to the EMA 56 to the upside and the RSI period 14 is already above the level 50. This means that a Bullish Confirmation Pattern would be generated once price goes above the supply zone at 125.50.