
The Dollar index is trading sideways. Price is still around the 38% Fibonacci resistance area, while the oscillators work off the overbought signals. We could see a pullback to 99 before more upside.
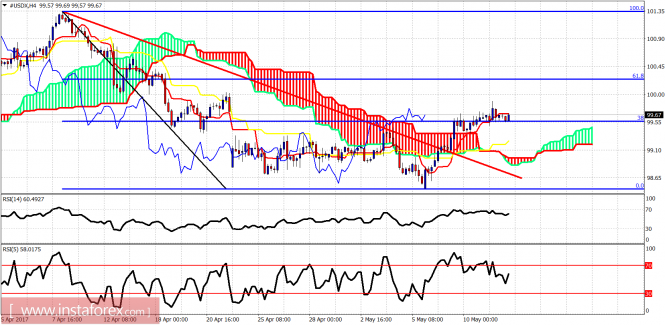
Price is trading above the 4-hour Kumo but below the tenkan-sen (red line indicator). We could see a pullback towards the cloud support at 99 before continuing the uptrend. Currently I expect price to move lower and test support.
Green line - long-term support trend line
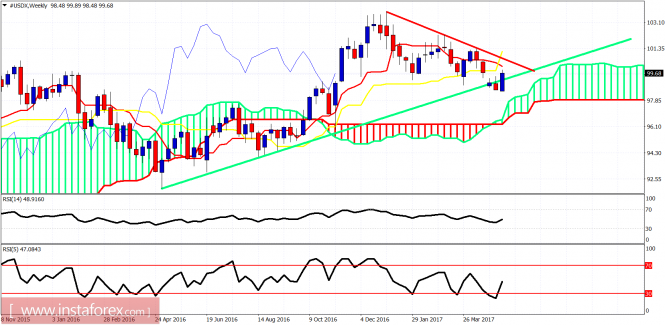
The Dollar index is testing weekly kijun- and tenkan-sen resistance. Price is below the important red trend line resistance but has also moved back above the long-term support trend line. The index is at a critical junction. Breaking to a new weekly low will be very bearish for the Dollar.
The material has been provided by InstaForex Company - www.instaforex.com