Global macro overview for 04/05/2017:
The latest Energy Information Administration (EIA) data recorded another inventory draw of -930k barrels for the week ending April 28th. Market participants expected larger stockpiles decrease of -3,300k barrels after a draw of -3,641k barrels last week. Nevertheless, the domestic crude oil production increased 0.3% to 9,290k barrels per day with a 5.2% increase over the year. This increase in production caused renewed concerns over production trends after smaller increases in the previous two weeks.
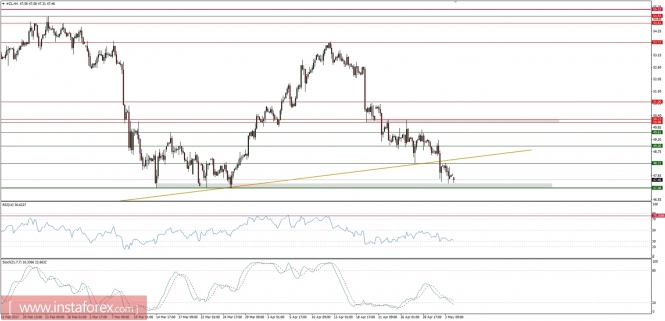
Let's now take a look at the Crude Oil technical picture on the H4 timeframe. The price fell from around $53.5 to $47.30 in a few days. The rate this morning not only tests the holes this week but also the support line run through the lows of March 2016 and November 2016. Taking into account that the market is significantly oversold and visible divergence between the momentum oscillators and price, there is a high probability of rebounding. The next resistance is seen at the level of $48.21. If the bulls manage to break out above it, then the downside test of the golden trend line around the level of $48.50 is to follow.