
Gold price continues to trade below important resistance of $1,250-55 inside a bearish channel. Gold could continue towards $1,240 but overall we remain bullish looking for $1,300-$1,320 over the next couple of weeks.
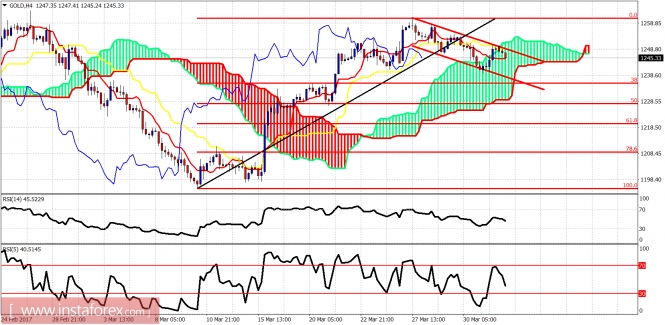
Short-term resistance is found at $1,252-55 area. Support is at $1,240. If resistance is broken I would expect Gold price to move towards $1,280. If support fails we should move towards $1,220. Short-term trend is neutral as the price is inside the cloud.
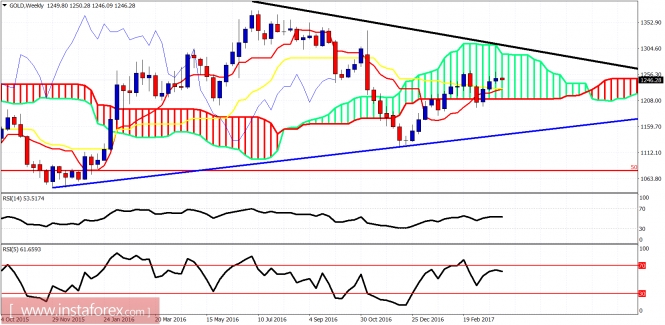
Blue line- long-term support
Gold is inside the weekly cloud. Long-term trend is neutral as long as the price is below the black trend line resistance. I expect this resistance trend line to be tested soon. The bulls must not break below the upwards sloping blue trend line support. This means that a break below $1,194 will be a bearish sign.
The material has been provided by InstaForex Company - www.instaforex.comfrom www.instaforex.com https://www.instaforex.com/forex_analysis/90029/?x=BPDZ
via IFTTT