
Gold price continues to move sideways in a corrective manner. The move that started from recent highs is part of a correction and we are just above the 38% Fibonacci retracement of the rise from $1,246. I remain longer-term bullish but cannot rule out a steep decline towards $1,250 before the resumption of the up trend.
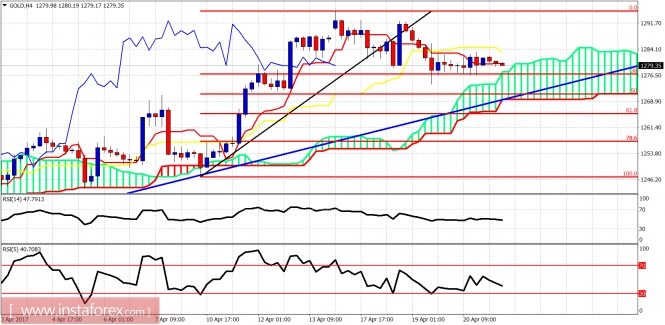
Blue line - support trend line
Gold price is trading above the Ichimoku cloud in the 4-hour chart. Price is trading below the kijun-sen and the tenkan-sen. Oscillators are now again in a neutral zone. Price is mainly moving sideways above the 38% Fibonacci retracement. Short-term support is at $1,275. Resistance is at $1,285.
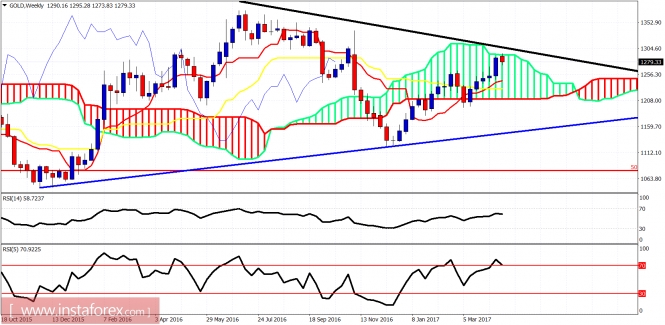
Blue line - long-term support
Gold price has stopped its up trend just below the long-term black trend line resistance and the upper cloud boundary. This is an important resistance area. The trend line comes back from the all time highs in Gold, so breaking it will be an important bullish signal for a bigger move higher and not just 20-30$. I remain longer-term bullish.
The material has been provided by InstaForex Company - www.instaforex.com